May 15th, 2026
What's new in the Report Builder
We've made it faster to build reports by making finding the right data source quicker, and by giving you more control over how widgets sit on the page.
Find data sources faster with categories

The widgets panel on the left now groups every data source by category. Instead of scrolling through one long flat list, you'll see clean category cards (e.g. Events, Memberships, Merchandise) showing how many data sources sit inside each one. Click a card to drill in, use the Back button to return, or use the search box at the top to flat-search across every category at once.
Grid-style report layouts

Reports are no longer locked to one widget per row. The canvas is now a true 12-column grid powered by GridStack:
Drag widgets anywhere. Drop a data source on the canvas, then drag it left/right or up/down to position it next to other widgets.
Resize by dragging the edge. Grab the left or right edge of any card and drag — the width snaps to 1/3 (4), 1/2 (6), 2/3 (8) or Full (12) so layouts stay aligned.
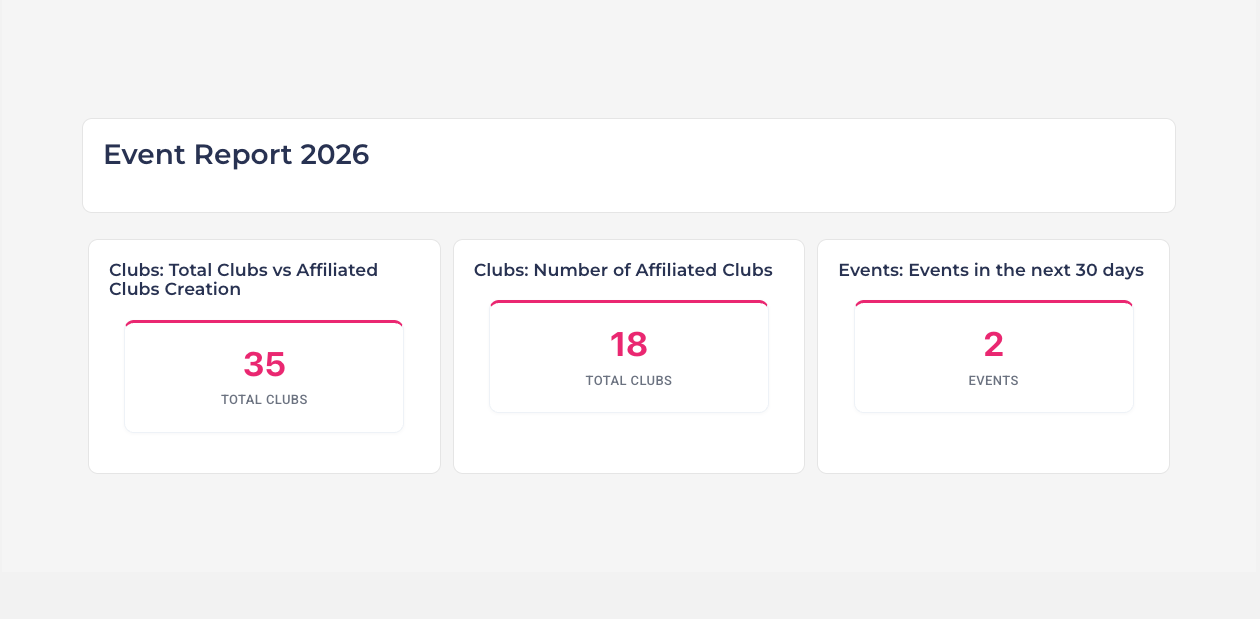
Side-by-side widgets. Place up to three widgets in the same row (e.g. a metric + a pie chart + a table) and the grid keeps everything tidy.
Auto-pack. Widgets automatically pull up against the row above, so there are no awkward empty gaps when you delete or move things around.
Jump into the Report Builder and give it a try!